
Electronicseng General: A Site-First Method for Setting Fixed Solar Panel Tilt in Dense Cities from One Spherical Photo
By Rachel Williams · Electronics & Engineering · General desk · Contact: info@electronicseng.com
For most urban low-power products, the limiting factor is not the regulator topology or the standby current of the controller. It is the angle at which a small fixed panel meets its own neighborhood. A wireless sensor node mounted under an eave, a roadside charging station, an illuminated sign or a parking kiosk rarely has room for a tracker and rarely enjoys an unobstructed sky either. The practical engineering question is therefore how to commit to one permanent orientation for a surface that will spend years looking at buildings instead of at a clear horizon.
Why the front end dominates an urban energy budget
Power management begins at the source. With photovoltaic panels the textbook logic looks simple: collect as many incoming photons as possible, and add mechanical tracking wherever the budget allows. In open settings, where the sky is fully or almost fully visible, that logic is not too hard to apply in principle.
Dense urban blocks invert the problem. Nearby buildings, their shadows, reflections from glass and other façades, and a restricted sky view reshape the light path before it reaches the cell. The difficulty is sharpest for small fixed panels serving localized, not grid-connected uses such as charging stations, signage and kiosks, where the intuitive plan to “point it at the sun’s maximum” is frequently not the best answer.
Site-evaluation tools exist for exactly this reason. A panel’s irradiance is commonly assessed with a 3D model, yet such a model can miss the small nearby structures that still bend light paths and shift net irradiance. Because raising the efficiency of the panel itself is difficult, and because conversion, management electronics and the overall power path are already heavily optimized, improving energy capture at the front end is the cheaper and more available lever.
The method: one spherical image as a site sensor
Recognizing that need, a research team in the Engineering School at Columbia University in New York built a system that derives the year-round optimal orientation and tilt of a panel from a single spherical photograph taken at the target site. The calculation accounts for the sun’s angle, shading from adjacent structures, diffuse light arriving through a partially visible sky, reflections off windows, and the character of building façades — all features of the so-called urban canyon.
The reported effect is an increase in solar capture of 10% at the conservative end and as high as 30% at the optimistic end, obtained with no extra cost. For equipment that is already installed or about to be bolted in place, a gain of that size without new hardware is the nontrivial part.
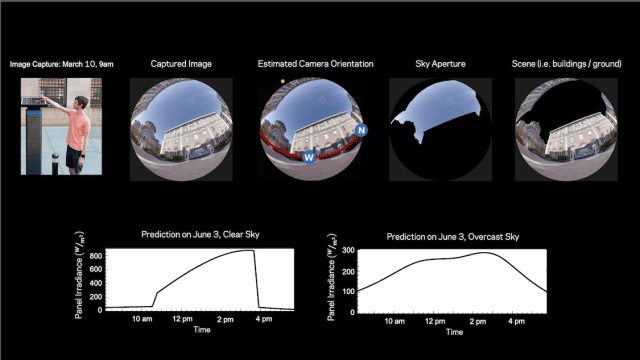 Figure 1: From one spherical image taken at the planned mounting point, the system reads location, position, time of day and date, estimates daylight solar radiation for all days and for likely weather conditions, and then selects the orientation that maximizes captured solar energy. (Image source: Columbia University/Nayar Lab)
Step one: recover the geometry from the photograph
Standard estimates can generate large errors because they do not capture how the brightness of the sky section actually visible to a panel shifts across the day and the year, nor how light reflects off surrounding buildings. Those reflections turned out to account for roughly 12% of a panel’s total annual energy, on average.
The core insight of the work is that a photograph taken at the panel’s own location already carries a large amount of site information. Shadows inside the frame reveal the direction of the sun; straight architectural lines reveal the direction of gravity. Those two cues let the image be oriented relative to the Earth coordinate frame, after which a segmentation algorithm identifies the sky visible to the panel while the appearance of neighboring buildings supplies cues about spatial layout and building materials.
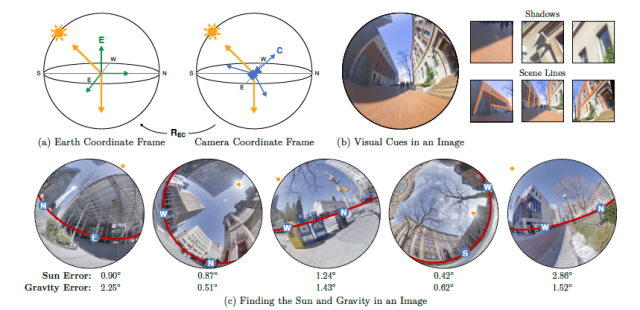 Figure 2: Camera orientation estimated from a single image. (a) A rotation R EC links the Earth coordinate frame E to the camera coordinate frame C. (b) Visual cues expose the sun direction (top row, from building and object shadows) and the gravity direction (bottom row, from scene lines) in camera coordinates. (c) Neural-network outputs for five different images, each with its prediction error. The sun need not fall inside the field of view; the frame only has to contain shadows that encode its direction. (Image source: Columbia University/Nayar Lab)
Step two: forecast irradiance for every day of the year
With the geometry registered, the laptop-based system projects the sun’s path through the visible sky over the day and the year, estimates how much light bounces off surrounding buildings onto the panel, and uses historical weather data to stretch the prediction beyond clear days to cloudy and overcast conditions.
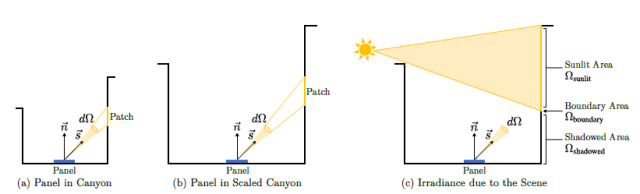 Figure 3: Properties of scene irradiance. (a) A panel inside an urban canyon. (b) The same panel in a scaled version of that canyon. (c) With the scene lit by the sun moving through the sky and treated as Lambertian, irradiance contributed by patches in the sunlit area (Ω sunlit) and the shadowed area (Ω shadowed) changes only slowly with time. (Image source: Columbia University/Nayar Lab)
A physically based renderer was used to simulate scene irradiance as a function of the sun’s position. Even with many objects casting shadows and producing reflections inside the canyon, the scene irradiance varies smoothly over the course of a day — a property the team exploited. After rendering irradiance at 54,933 different locations for every sun position in a Lambertian urban environment and running principal component analysis, a compact set of coefficients was shown to represent the behavior.
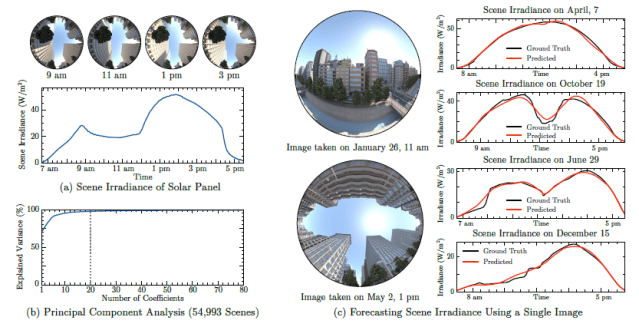 Figure 4: Forecasting scene irradiance from one image. (a) Simulated irradiance of a panel in an urban environment across one day; the illumination is complex, yet the scene contribution varies smoothly with time. (b) Variance explained in scene irradiance as a function of the number of coefficients used, based on renderings at 54,933 locations for every sun position. (c) A trained neural network predicts scene irradiance from a single hemispherical image, here for two rendered scenes on two days with different sun paths. (Image source: Columbia University/Nayar Lab)
The predictor itself is a neural network with a vision transformer backbone and a multilayer perceptron (MLP) head that outputs scene irradiance for any requested sun position. Given the sky condition and sun position for a future time, plus the image, camera orientation and sky aperture, the pipeline forecasts the sun component (E sun), the sky component (E sky) and the scene component (E scene); their sum is the total predicted panel irradiance (E total). The process is automatic, and the only required measurement is a single image, along with the time of day it was captured and the GPS location.
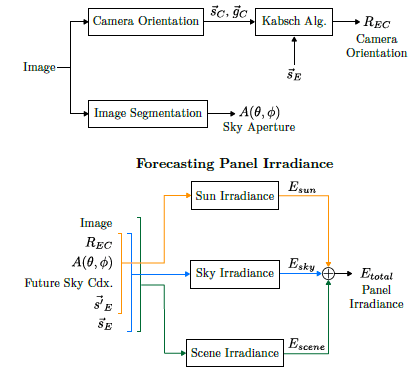 Figure 5: The complete pipeline for forecasting a panel’s irradiance from one image. Sun and gravity directions are first estimated in the camera coordinate frame to fix camera orientation; sky condition and sun position at a future time are then supplied as inputs, and combined with the image, camera orientation and sky aperture to produce the sun, sky and scene irradiance terms that sum to the total. (Image source: Columbia University/Nayar Lab)
What the results say about the old rule of thumb
The familiar heuristic states that the best fixed panel orientation points toward the equator, with a zenith angle equal to the panel’s latitude. That assumption requires a clear view of the sky, which is rare in urban settings. The researchers showed instead that one spherical image taken near an existing panel can identify a best fixed orientation that may differ substantially from the rule of thumb, and they validated the approach with actual irradiance measurements inside urban canyons.
Common misconceptions when fixing a tilt
| Misconception | Why it misleads in a city | Better practice |
|---|---|---|
| Aim at the sun’s highest point. | The light path in a canyon is dominated by shading, restricted sky view and façade reflections, so “point it at the sun’s maximum” is often not the best answer. | Derive the orientation from site imagery rather than from a solar-noon assumption. |
| Face the equator and use latitude as the zenith angle. | The rule assumes an unobstructed sky, which is rarely available where buildings crowd the panel. | Treat the latitude rule as a starting guess, then compare it with the site-derived optimum. |
| A block-level 3D model is enough. | Such models can miss small nearby structures that influence light paths and net irradiance. | Verify the model against an image taken at the exact mounting position and, where possible, against measured irradiance. |
| Reflections from neighbors are negligible. | Reflected light was found to contribute roughly 12% of total annual energy on average. | Include glass and bright façades in the estimate of incident energy. |
| The sun must be in the photograph. | Only shadows are needed to encode the sun’s direction, and architectural lines to encode gravity. | Capture the scene whenever usable shadows and straight lines are present. |
| More capture always means a tracker. | Reported gains of 10% to as much as 30% came from orientation selection alone, with no extra cost. | Exhaust the fixed-orientation solution before buying mechanical tracking. |
Site-survey checklist for a fixed urban array
- Take one spherical photograph from the exact position the panel will occupy, not from a convenient distance away.
- Record the time of day the image was captured and the GPS location of the mount; these are the only measurements the pipeline requires.
- Confirm the frame contains usable geometric cues: object and building shadows for the sun’s direction, straight architectural lines for the direction of gravity.
- Identify which neighboring surfaces are glass or other reflective façades, since reflections feed a meaningful share of annual energy.
- Estimate the sky aperture — the portion of sky the panel can actually see after adjacent structures are accounted for.
- Run the orientation estimate over the whole year, using historical weather data so that cloudy and overcast days are weighted alongside clear ones.
- Compare the computed optimum with the latitude-based rule of thumb; where they disagree, prefer the site-derived angle and record the margin.
- Where instrument access exists, spot-check the prediction with real irradiance measurements taken in the canyon before drilling the final mounting hardware.
- Apply the result to localized, not grid-connected loads — charging stations, signage, kiosks and similar small fixed installations — where tracking is impractical.
FAQ
Why does a city site behave so differently from an open rooftop or field?
In open settings the sky is fully or almost fully visible, so aiming for the maximum number of incoming photons is a workable rule. In dense urban settings, nearby buildings, shadows, reflections from glass and other façades, and a limited sky view all change the light path, so the same reasoning can point the panel the wrong way.
Do I need LiDAR, a drone survey or a full 3D model of the block?
No. The demonstrated system reads a single spherical image taken at the site, estimates camera orientation from shadows and straight lines, segments the visible sky and infers layout and materials from the appearance of surrounding buildings. A 3D model is a common alternative, but it can omit small nearby structures that still matter.
How much does this actually improve the energy budget?
The team reported an increase in solar capture ranging from 10% to as high as 30%, achieved without extra cost — which is why the result matters for constrained, off-grid electronics rather than only for large arrays.
Does the method touch the panel or the power electronics?
No. Panel efficiency is difficult to raise, and conversion, management electronics and the power path are already well developed; this approach improves capture at the front end, before any of that circuitry sees the energy.
Is the work available to read?
Yes. The study, titled “Forecasting solar energy using a single image,” was published in Solar Energy and runs to 23 pages! — lengthy, but highly readable. The formal posting is behind a paywall, while an open version is posted on arXiv, a free, non-profit repository that hosts scholarly preprints before formal peer review and journal publication.
The transferable lesson for hardware teams
Treated as a design input rather than a rule of thumb, the mounting angle becomes an ordinary engineering decision: measure the site once, register the measurement against the planet, model the light that actually arrives, and fix the hardware accordingly. The spherical photograph stands in for a survey campaign in exactly the situations where small fixed panels are most common and where tracking is least affordable. That shift — from generic solar charts to a site-derived answer, verified against measured irradiance — is the part of the work most easily carried over into other urban power designs, and the reason a single image now belongs in the same requirements review as the load profile and the battery.